T-SQL ranking functions to the rescue once again!

This week I happened to assist with an internal application where there was a performance issue with a specific query. One of my observations with that query was that it was doing self-joins in order to determine the latest iteration of a specific record. That’s a common anti-pattern which can be fixed by using T-SQL’s windowing functions, such as ROW_NUMBER() or RANK().

The Inefficient Way

To give more context, here is an example from the Contoso Retail DW database. The requirement (very similar to the actual customer case) here is to obtain a list of all the customers who have placed an order with us, and for each of those customers, obtain the date of the latest order. The implementation that I first noticed was using a self-join as given below; notice the special case handling where the customer has 2 orders on the same day and then the order number (the OnlineSalesKey column here) becomes the tie-breaker:

SELECT l.CustomerKey
	,l.DateKey AS LatestOrder
FROM dbo.FactOnlineSales l
LEFT JOIN dbo.FactOnlineSales r ON l.CustomerKey = r.CustomerKey
	AND (
		l.DateKey < r.DateKey
		OR (
			l.DateKey = r.DateKey
			AND l.OnlineSalesKey > r.OnlineSalesKey
			)
		)
WHERE r.DateKey IS NULL

This query is *extremely* inefficient, burning 100% CPU on my i7 laptop with 8 logical CPUs! On my laptop it will run for well over 10 minutes before I get impatient and cancel. For reference, here is the estimated execution plan for the above query (scroll to the right and note the query cost of 167692).

badplan

Just for kicks, I ran the above query with MAXDOP 144 (NOT a good idea, but this was for fun) on our lab machine which has 144 logical CPUs and here is the picture I see there 🙂 Obviously NOT something you want in production!

144procs

Rewriting the query

Now, the efficient way to re-write this is to use Ranking Functions in T-SQL. These have been around a while (SQL 2005 actually!) but I feel they are under-utilized. Here is the query re-written using the ROW_NUMBER() function. This solution also elegantly takes care of the above tie-breaking logic which required the disjunction (OR predicate) in the previous query.

WITH NumberedOrders
AS (
	SELECT CustomerKey
		,Datekey
		,ROW_NUMBER() OVER (
			PARTITION BY CustomerKey ORDER BY Datekey DESC
				,OnlineSalesKey DESC
			) AS RowNumber
	FROM FactOnlineSales
	)
SELECT CustomerKey
	,Datekey
FROM NumberedOrders
WHERE RowNumber = 1

Here is the new execution plan. Note that the cost is also much lesser: 447.

goodplan

Here are the execution statistics of this query, it completes in 43 seconds compared the self-join approach taking forever!

  • Table ‘FactOnlineSales’. Scan count 9, logical reads 92516, physical reads 0, read-ahead reads 72663, lob logical reads 0, lob physical reads 0, lob read-ahead reads 0.
  • Table ‘Worktable’. Scan count 0, logical reads 0, physical reads 0, read-ahead reads 31263, lob logical reads 0, lob physical reads 0, lob read-ahead reads 0.
  • SQL Server Execution Times:
  • CPU time = 19231 ms, elapsed time = 43834 ms.

Moral of the story: next time you see query patterns involving self joins to achieve this kind of ‘latest record of a particular type’ take a pause and see if T-SQL Ranking Functions can help!

Common sub-expression elimination in SQL Server: what you need to know

In working with our customers, I come across some very interesting patterns in T-SQL. Not all of these patterns are complex on the face of it, but their impact can sometimes be substantial. Here is a simple example to demonstrate what I am referring to:

SELECT CASE WHEN EXISTS (SELECT *
                         FROM   Person.Person AS P
                         WHERE  P.BusinessEntityID = SOD.ProductID) THEN 1 ELSE 0 END AS Col1,
       CASE WHEN EXISTS (SELECT *
                         FROM   Person.Person AS P
                         WHERE  P.BusinessEntityID = SOD.ProductID) THEN 1 ELSE 0 END AS Col2
FROM   Sales.SalesOrderDetail AS SOD;

This query is clearly fictional, but it will suffice for our walkthrough here 🙂 Now here’s the execution plan for the above statement (you can also test this by using AdventureWorks2012 and above):

httpsmsdnshared.blob.core.windows.netmedia201606image922

Observe that the Person.Person table is accessed twice in the above plan. In the real customer scenario that I was looking at, the table involved was accessed using a nested loop join, for a total of 13 million seeks. And these 13 million were repeated again for the second usage of the subquery.

My attempt to rewrite the query was to use a LEFT OUTER JOIN syntax, as reflected in this simple example:

select CASE WHEN P.BusinessEntityID IS NOT NULL THEN 1 ELSE 0 END as Col1,

CASE WHEN P.BusinessEntityID IS NOT NULL THEN 1 ELSE 0 END as Col2

from Sales.SalesOrderDetail SOD

LEFT OUTER JOIN Person.Person P ON P.BusinessEntityID = SOD.ProductID

Here is the execution plan for the optimized version:

httpsmsdnshared.blob.core.windows.netmedia201606image923
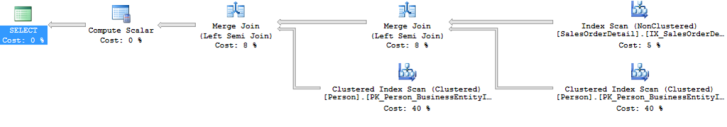
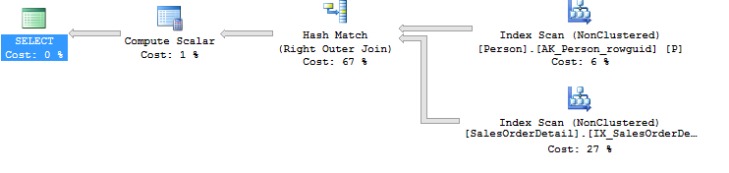
These two queries are functionally equivalent (because in this case there is a unique key on the BusinessEntityId column) and return the same set of results. As you can see the Person table is just accessed once in the revised query. The cost of the re-written query is also ~ 6 times lesser than the original query! This kind of optimization is referred to as Constant Subexpression Elimination. There are some strategies used by SQL Server (see this paper and this one as well for some ideas) but not every possible scenario (such as the above one) can be optimized. Also, this paper from Microsoft Research covers future ideas on the topic.

For now, it is best to review your T-SQL code for multiple instances of the same subquery and replace those with an explicit JOIN instead.

Query of the day: finding SQL Server queries with large memory grants

Quick tip from me today: I recently had to check on which T-SQL query / queries in the system were using up some monster 30GB+ query grants. Luckily the sys.dm_exec_query_memory_grants DMV facilitates this. Here is the query I finally used to figure out what was happening:

SELECT r.session_id
    ,mg.granted_memory_kb
    ,mg.requested_memory_kb
    ,mg.ideal_memory_kb
    ,mg.request_time
    ,mg.grant_time
    ,mg.query_cost
    ,mg.dop
    ,(
        SELECT SUBSTRING(TEXT, statement_start_offset / 2 + 1, (
                    CASE
                        WHEN statement_end_offset = – 1
                            THEN LEN(CONVERT(NVARCHAR(MAX), TEXT)) * 2
                        ELSE statement_end_offset
                        END – statement_start_offset
                    ) / 2)
        FROM sys.dm_exec_sql_text(r.sql_handle)
        ) AS query_text
    ,qp.query_plan
FROM sys.dm_exec_query_memory_grants AS mg
INNER JOIN sys.dm_exec_requests r ON mg.session_id = r.session_id
CROSS APPLY sys.dm_exec_query_plan(r.plan_handle) AS qp
ORDER BY mg.required_memory_kb DESC;

In case you are wondering what memory grants are all about, you should start from this great blog post from Jay Choe, who is part of the SQL Server development team. Jay also posts some useful variants of queries to find out (for example) cached query plans with memory grants. It is a great read.

Happy query tuning!

Exotic spinlocks: X_PACKET_LIST and XID_ARRAY

A Twitter conversation sparked this blog post; the question there was about the relevance of the X_PACKET_LIST spinlock. As with most spinlocks, there is no public documentation on this one, and that is primarily because the spinlock is an implementation detail and can change from release to release.

‘Do it yourself’

That said, we can uncover some basic details about this spinlock. As preliminary reading, I suggest that you read Craig Freedman’s post on the way parallelism is implemented in SQL Server. Next, it may help if you can get handy with a debugger and SQL Server public symbols, something on the lines of this SQLCAT blog post. Another useful background read is Paul White’s post where he alludes to some of the architecture elements behind parallelism.

Now, I am going to simplify things within the limits of what we can disclose publicly. FYI, the information I share below can be obtained by anyone with a little bit of WinDbg magic and co-relating to the sys.dm_xe_map_values DMV. For example, if you look at the call stack in the SQLCAT team blog post and later poke around in the debugger with some breakpoints and the x (Examine Symbols) command, you can deduce the following:

  • An exchange (parallelism) operation has CXPipe instances. Conceptually think of these as the ‘wiring’ between producers and consumers within a parallel exchange (see sqlmin!CXPipe::NewRow and sqlmin!CXPipe::GetRow in the debugger)
  • These pipes have a CXPacketMgr class which in turn has a CXPacketList. From the name it suggests that this is a data structure into which producers insert (sqlmin!CXPacketList::Append in the debugger) and consumers pull packets from (sqlmin!CXPacketList::RemoveHead in the debugger.)
  • Any shared data structure must be protected for this kind of concurrent access, and the way we chose to do it in SQL is to use a spinlock – the X_PACKET_LIST spinlock.

Connecting the dots

Now, in Christian’s case (from the Twitter thread) he was also observing relatively high spins and backoffs for XID_ARRAY spinlock. That one is also related to the parallelism implementation. To explain this, there are two other classes of interest: a CXPort class and a CXId (Exchange ID for each worker). For simplicity, think of the CXPort having entries for the CXIds (representing worker threads) in the form of an array. Access to that array is protected using the XID_ARRAY spinlock.

Conclusion

So in conclusion, both these spinlocks have everything to do with parallelism. Experimenting with different values for MAXDOP may be beneficial, and also check if there are excessive amounts of data (LOB data maybe) flowing in the exchange. Beyond that, if you are in doubt or clueless, please do not hesitate to contact Microsoft Customer Support Services (CSS) and log an incident to debug the root cause.

Tracking TEMPDB internal object space usage in SQL 2012

It is a documented fact that using the MAX specifier can result in TEMPDB usage in specific cases. From the TEMPDB whitepaper, some of these can use ‘internal object’ space within TEMPDB:

“all of the large object types: text, image, ntext, varchar(max), varbinary(max), and all others.”

Now, a FAQ from our customers is how to drill down to session level usage of TEMPDB when they suspect abnormal growth. Normally, the sys.dm_db_session_space_usage gives us the details we need. But are there any other options to see deeper? We wanted to test this and observe the effects. To do this, we created a simple stored procedure and a corresponding C# console application which passes in a large valued parameter.

Stored procedure code

create procedure testvarcharmax(@s varchar(max))
as
select @@version

C# application code

Here is the simple front-end application code which invokes the ‘testvarcharmax’ procedure:

SqlConnection cn = new SqlConnection("Data Source=.;initial catalog=tempdb;integrated security=true");
cn.Open();

SqlCommand cmd = new SqlCommand();
cmd.Connection = cn;
cmd.CommandType = System.Data.CommandType.StoredProcedure;
cmd.CommandText = "testvarcharmax";
SqlParameter parameter = new SqlParameter("s", System.Data.SqlDbType.VarChar, -1);
parameter.Value = new StringBuilder().Insert(0, "a", 1000000000).ToString();
cmd.Parameters.Add(parameter);
cmd.CommandTimeout = 360;

cmd.ExecuteNonQuery();

Monitoring TEMPDB

After executing the above C# code, my TEMPDB quickly grew by leaps and bounds. As any DBA would understand, the essential ask in such cases is to trace the session ID which is generating this TEMPDB space usage. One option is to use the sys.dm_db_file_space_usage DMV. That one is useful in this case, as it reports the aggregate space for the internal objects:

SELECT SUM(internal_object_reserved_page_count) AS [internal object pages used], (SUM(internal_object_reserved_page_count)*1.0/128) AS [internal object space in MB] FROM tempdb.sys.dm_db_file_space_usage;

However the above does not provide a session-level detail. To obtain that, you can use the queries on sys.dm_db_session_space_usage and sys.dm_db_task_space_usage as shown below:

select * from tempdb.sys.dm_db_session_space_usage
order by internal_objects_alloc_page_count desc

select * from tempdb.sys.dm_db_task_space_usage
order by internal_objects_alloc_page_count desc

Update: Adam Machanic pointed out that it is much easier and lightweight to use the sys.dm_db_task_space_usage and sys.dm_db_session_space_usage DMVs to track internal object usage to a given task / session. Please use the detailed approach described below only if you have a specific need to investigate lower-level details, such as a potential product issue or such.

Digging deeper

Suppose you suspect a ‘leak’ in TEMPDB objects of some sort, and you need to really peer deep into TEMPDB page allocation / deallocation. To peer more into the internals, KB article 947204 provides an interesting approach using the allocation ring buffer using trace flag 1106. This can be useful in rare cases, but first do note the important disclaimer about this flag:

Note We recommend that you do not use trace flag 1106 on production servers because trace flag 1106 affects the performance of SQL Server.

Note that the query specified therein does not return results on SQL 2012 even after enabling trace flag 1106. It turns out that the query requires a minor change, as the XML schema and the name for the ring buffer has changed in SQL 2012. The new name for the ring buffer is RING_BUFFER_SPACEMGR_TRACE. And here is the modified query, reflecting changes in the XML schema as well:

SELECT top 500
record.value(‘(Record/@id)[1]’, ‘int’) AS record_id,
CONVERT (varchar, DATEADD (ms, -1 * ((inf.cpu_ticks / inf.cpu_ticks) – [timestamp]), GETDATE()), 126) AS EventTime,
[timestamp] ,
  record.value(‘(Record/@id)[1]’, ‘int’) AS RingBuffer_Record_Id,
  record.value(‘(Record/SpaceMgr/Event)[1]’, ‘int’) AS AllocationEventType,
  record.value(‘(Record/SpaceMgr/SpId)[1]’, ‘int’) AS SpId,
  record.value(‘(Record/SpaceMgr/EcId)[1]’, ‘int’) AS EcId,
  record.value(‘(Record/SpaceMgr/PageId)[1]’, ‘nvarchar(50)’) AS AllocatedPageId,
  record.value(‘(Record/SpaceMgr/AuId)[1]’, ‘nvarchar(50)’) AS AllocationUnitId,
  record.value(‘(Record/SpaceMgr/LsId)[1]’, ‘nvarchar(50)’) AS LsId
FROM sys.dm_os_sys_info inf CROSS JOIN (
SELECT timestamp, CONVERT (xml, record) AS record
FROM sys.dm_os_ring_buffers
WHERE ring_buffer_type = ‘RING_BUFFER_SPACEMGR_TRACE’
AND ( record LIKE ‘%<Event>23</Event>%’ — uniform extent allocation
OR record LIKE ‘%<Event>22</Event>%’ — uniform extent deallocation
OR record LIKE ‘%<Event>24</Event>%’ — mixed extent allocation
OR record LIKE ‘%<Event>25</Event>%’ — mixed extent deallocation
OR record LIKE ‘%<Event>10</Event>%’ — page allocation
OR record LIKE ‘%<Event>11</Event>%’ — page deallocation
)) AS t
    ORDER BY record.value(‘(Record/@id)[1]’, ‘int’) ASC

The results of the ring buffer query are too detailed for most real-time scenarios and the overheads associated with the trace flag make it impractical, as compared to the sys.dm_db_session_space_usage DMV. But if you happen to use the approach in KB 947204 on SQL 2012 for some really low level debugging, please take note of the above changes.

Reference

Queries useful for troubleshooting TEMPDB space usage

Indexed views with remote tables–possible?

Once upon a time, I had this question come up during an onsite visit: someone wanted to create a ‘materialized’ copy of the remote data locally as an indexed view. I had never heard that requirement before, but since the motivation was genuine, I decided to validate it.

There is a long list of what is permitted (and what is not) in indexed views. One fundamental requirement is that the view on which the index is created, must be schema-bound. And this fundamental requirement, actually nails the answer straight away: any attempt to create a schema-bound view which references a remote table ends up with the SQL error 2014:

Remote access is not allowed from within a schema-bound object

Now that it is clear that such ‘projection’ is not possible, we have to step back and understand the real problems why this requirement was posed. In most cases, such ideas come up for improving performance of distributed queries (DQ). For all such cases, I suggest you first start by reviewing the excellent talk from Conor on DQ.

But in many cases, especially where multiple remote data sources are involved, probably the best way to optimize the queries is to consolidate the data inside a data mart or warehouse, and then possibly consider the columnstore index (or the new Clustered Columnstore in SQL 2014) feature to optimize the aggregation-type queries which are very typical in those scenarios.

Exotic spinlocks: XTS_MGR

My friend and colleague – Fabricio Catae – had blogged about spinlocks previously. In one of the comments, a visitor has asked him about the XTS_MGR spinlock. There is no public documentation about this spinlock, because it is largely implementation specific detail.

However, a general explanation is that this spinlock is taken out in many functions within SQL Server, most of which are responsible for version store operations (when you enable Read Committed Snapshot for example). So if you ever face contention for this spinlock, one thing to consider is the effect of highly concurrent and extensive DML workloads, which generally work the version store much harder. Other than that, it is best to contact Microsoft CSS if you suspect that this contention is causing problems on your instance of SQL.

More information on the version store can be found here:

If you have more questions or have seen other spinlocks which you are curious about, do leave a comment. I’ll see what we can explain regarding those!

Normalizing T-SQL text, part 1: using the RML Utilities and the DMVs

A common problem when dealing with workloads which issue ad-hoc SQL commands (i.e. without parameterization) is to find out the ‘normalized’ version of the pattern. For example, these three statements are essentially the same ‘template’:

  • SELECT BusinessEntityId FROM Person.Person WHERE LastName = ‘Smith’
  • SELECT BusinessEntityId FROM Person.Person WHERE LastName = ‘Singh’
  • SELECT BusinessEntityId FROM Person.Person WHERE LastName = ‘Lee’

And so are these three, except that they are a distinctly new pattern:

  • SELECT * FROM Person.person WHERE LastName IN (‘Smith’)
  • SELECT * FROM Person.person WHERE LastName IN (‘Smith’, ‘Singh’)
  • SELECT * FROM Person.person WHERE LastName IN (‘Smith’, ‘Singh’, ‘Lee’)

The requirement therefore is to detect only the common ‘template’ / ‘normalized’ text – in most cases a representative example of the ad-hoc statement. In this post, I will show you the classic ways to do that: using the RML Utilities (specifically using ReadTrace) or using the query_hash value in the DMVs.

Option 1: Using the RML Utilities / ReadTrace

The classic way to do with profiler traces of course, was to capture a trace file (using server side tracing preferably) and then run that trace through the ReadTrace utility. The neat thing about this utility is that it would ‘aggregate’ similar patterns into hash buckets and then display statistics for each hash ID. To do that successfully, it requires a SQL instance and database.

Here is a sample command line for using this utility:

readtrace -Ic:temptest.trc -S. -dTest -f

The above imports the trace (from c:temptest.trc) into a database called Test on my local default instance of SQL 2012. Once that is done, you can work your magic on the various tables which are created by this utility and extract the unique batches:

SELECT OrigText, HashID
FROM ReadTrace.tblUniqueBatches

Here is the sample output from my test, where I had issued those 6 statements (each delimited by a GO) which were shown at the beginning of this post:

  • SELECT BusinessEntityId FROM Person.Person WHERE LastName = ‘Smith’ => hash value of -8759399170292131263
  • select * from Person.person where LastName IN (‘SMith’) => hash value of 1644287078950160061

So the good news is that this utility correctly found the underlying patterns very accurately, but it also requires extra efforts (to provision a SQL instance and gather a trace file.) One other advantage with the ReadTrace utility is that it also supports importing Extended Event Logs (XEL) files as well (though that feature is still in Beta.)

For more details on the normalization capabilities within ReadTrace, Download RML Utilities for SQL Server (x64) and then read the PDF help file. The various patterns are described in the section ‘Normalization Patterns’.

Option 2: Using the query_hash value

Starting SQL Server 2008 and above you can use the query_hash functionality to isolate these common patterns. Here is an example of a query which can do that and list one sample query for each ‘pattern’:

select * from
(select ST.text, ROW_NUMBER() OVER (PARTITION BY query_hash ORDER BY query_hash) Ranking from sys.dm_exec_query_stats QS
cross apply sys.dm_exec_sql_text (QS.sql_handle) ST
where objectid IS NULL
and ST.encrypted = 0
) AS Q
where Q.Ranking = 1

While this is easy to use and available out of the box, it does not work for SQL 2005 or obviously not for SQL 2000 (why do I even bring up SQL 2000, given that it is out of support? When upgrading those few workloads from SQL 2000 to higher versions, it is appropriate to tune some of this stuff by replacing them with parameterized queries.)

Also, there is another problem with IN predicates. When there is a varying set of literals passed to the IN predicate, it turns out that the query_hash is different. Here is an example:

  • select * from Person.person where LastName IN (‘SMith’, ‘Singh’, ‘Lee’)  => hash value 0x6FAFADDF37AA7683
  • select * from Person.person where LastName IN (‘SMith’) => hash value 0x77A1391010F61AE7
  • select * from Person.person where LastName IN (‘SMith’, ‘Singh’) => hash value 0x9BEA60D8D6595AA5

Summary

I’d like to quickly compare these two approaches and then setup what’s coming next.

ReadTrace query_hash
  • Offline method
  • Can consume TRC or XEL files
  • Supports SQL Server versions 2000, 2005 and 2008, 2008 R2, 2012 and SQL 2014 CTP2 (version  9.04.0004 as of time of writing this post)
  • Correctly handles many patterns including IN lists
  • Online method
  • Requires SQL 2008 or above
  • Dependent on the query plan cache
  • Some limitations such as not aggregating IN predicate lists correctly

In the next part I will show you how you can cook your own ‘aggregator’ / ‘normalizer’ using the Transact-SQL ScriptDom parser and then compare it with these two approaches. Stay tuned!

Debugging story: Slowness due to NTFS short file (8.3) name generation

When I teach production debugging to my customers, I always tell them that be successful you need to not only know the right tool and command syntax, but also know the right methodology. And perhaps even more importantly when debugging certain types of issues, knowledge of Windows Internals and the ability to ‘connect the dots’ is a savior.

Recently, I had one such experience wherein an issue with an application turned out to be related to a NTFS behavior (which I had previously read about in my SQL Server work) and had I not ‘connected the dots’ I would not have been able to remediate the issue quickly. Wondering what it is all about? Read on!

Scenario

So this was a strange problem: a server had hundreds of processes which were all seemingly ‘hung’ and not doing anything. The server in question was hosting a vendor application, which had spawned those processes, but normally those processes should execute quickly and not accumulate they way they had done.

This appeared to me like the processes where hung in some way. Since the application was deployed as a service, these child processes were on a non-visible desktop, so maybe they had popped up an UI element – that was my first theory. But as with any user mode process hanging situation, I decided to collect hang mode dumps and look at those to be sure about the root cause. I took sample dumps from 2 processes using DebugDiag 1.2.

Dump analysis

Once the dumps were available, I opened them in WinDbg (x86, as these were 32-bit application processes.) Here are the call stacks of the dump for the first process:

0:000> kL
ChildEBP RetAddr 
0018d368 74cd9a04 ntdll!NtSetInformationFile+0x12
0018d43c 74cecd44 kernel32!MoveFileWithProgressTransactedW+0x334
0018d474 74ceccec kernel32!MoveFileWithProgressTransactedA+0x5b
0018d494 74d3d93f kernel32!MoveFileWithProgressA+0x1b
0018d4b0 00401302 kernel32!MoveFileA+0x16
WARNING: Stack unwind information not available. Following frames may be wrong.
0018d4cc 00401aa2 fooapp+0x7777
0018ff94 76fb9ef2 kernel32!BaseThreadInitThunk+0xe
0018ffd4 76fb9ec5 ntdll!__RtlUserThreadStart+0x70
0018ffec 00000000 ntdll!_RtlUserThreadStart+0x1b

The above call stack is due to a file being moved. In this case by dumping the parameters to MoveFileA, we found that the file was being renamed in the same folder (the file extension was being changed from .FOO to .BAR – file extensions changed to protect the identity Smile). The call stack for the thread in the second process is given below:

0:000> kL
ChildEBP RetAddr 
0018d38c 74c7c5dc ntdll!NtCreateFile+0x12
0018d430 74cc3f86 KERNELBASE!CreateFileW+0x35e
0018d45c 74cc53e4 kernel32!CreateFileWImplementation+0x69
0018d48c 004012b3 kernel32!CreateFileA+0x37
WARNING: Stack unwind information not available. Following frames may be wrong.
0018d4c0 004019df fooapp+8888
0018ff94 76fb9ef2 kernel32!BaseThreadInitThunk+0xe
0018ffd4 76fb9ec5 ntdll!__RtlUserThreadStart+0x70
0018ffec 00000000 ntdll!_RtlUserThreadStart+0x1b

The above is a call stack of the application creating a new file. By looking at both of these, it appeared to me that the hard disk was performing slowly. So we extracted the file name (the first parameter to CreateFileA routine) and found that it was a new file within a folder on the D: drive. When we ran performance counter logs for the D: drive, it appeared to be just normal.

So it was quite puzzling to see the calls to creating and renaming files taking so long despite the physical drive performing quite well.

Root cause

We then looked a bit further by browsing to the folder on D: drive which was being accessed by the above application. We could not even list the contents (Explorer would appear unresponsive.) It then came to our mind that when we have a large number of similarly named files in the same folder, (which was exactly the case with this application) then NTFS has to work extra hard to generate to unique 8.3 naming convention names (so called ‘short file name’.) This TechNet article mentions a threshold of 300000 files above which this short name generation can become a bottleneck. The algorithm for the short file name generation is also documented here and there is another very interesting but really old KB article which shows how to achieve the name conversion in FoxPro Smile

Now, these names are more of a legacy remnant of DOS and the 16-bit world, and in most servers there should not be any reason to use them. So thankfully we have a way to disable the generation of these short file names. I then tried to evaluate the effect that disabling this has. My test results are given below.

Testing

I executed a series of tests with a simple PowerShell script which creates and renames file in a tight loop. For each case, the folder already contained over a million files were already created in the same folder. My tests were done on a Windows 8 laptop with a single spindle SATA hard disk.

Test Description

File Count per process

Avg. time (8dot3 ON)

Avg. time (8dot3 OFF)

% Improvements

Single process creating files

25000

126028

102617

19%

5 process creating + renaming files

25000

567611

375946

34%

20 process creating files

25000

2420367

1422348

41%


Conclusion

The benefits of disabling 8dot3 name generation are obvious from the test results above, and validate the guidance given in the KB articles mentioned previously. And keep in mind these results were obtained on Windows 8 and Windows 2008 R2, wherein the algorithm for 8dot3 name generation has been further tuned. The gains might be even more dramatic on Windows 2003.

So in summary, we would like to confirm the benefits of disabling 8dot3 name generation on servers, where there are large number of similarly named files in the same folder. And for SQL Servers using FILESTREAM storage, this setting is recommended as well.


Further Reading

For more information on NTFS, I encourage everyone to take a look at the presentation that Neal Christiansen (Principal SDE, Microsoft) delivered in a community meeting. The presentation is found here: NTFS – The workhorse file system for the Windows Platform. Neal also has presented two excellent talks on Channel9, which can be accessed here and here. Amazing information, take a look!

Jose Barreto, Principal PM at Microsoft has blogged about the performance impact of 8.3 names. His TechEd 2011 presentation is also worth a look.

On a side note, Adi Oltean talks about potential security considerations when the 8.3 filename is used, do take a look!

Considerations when using the TransactSql.ScriptDOM parsers

Some of you might be aware of the above namespace, which holds an implementation of a first-class T-SQL parser. In this post I would like to explain some of the complexity you will face when dealing with the ScriptDOM yourselves, typically using Visitor pattern.

Case Study

Our objective in this case is to use the parser and implement a rule to find expressions which have a leading wildcard in them, within a WHERE Clause. Firstly, let us consider the T-SQL statement below:

SELECT * FROM Person.Contact
WHERE LastName LIKE ‘%mith’

If you parse this using ScriptDOM you can visit the LikePredicate element, and you can then typecast the SecondExpression to StringLiteral and then check if it starts with %.

public override void ExplicitVisit(LikePredicate node)
        {
            if (node.SecondExpression is StringLiteral)
            {
                if ((node.SecondExpression as StringLiteral).Value.StartsWith("%"))
                {
                        Console.WriteLine((node.SecondExpression as StringLiteral).Value);
                }
            }
        }

Now consider this second case, which has a complex expression (string concatenation)

SELECT * FROM Person.Contact
WHERE LastName LIKE ‘%’ + @blah + ‘%’

In this case, if you try to reuse the ExplicitVisit code mentioned above, it will fail to detect the issue. Because, the SecondExpression member of the LikePredicate is now a BinaryExpression. This complicates the check:

if (node.SecondExpression is BinaryExpression)
            {
               if ((node.SecondExpression as BinaryExpression).SecondExpression is StringLiteral)
                {
                   if ((((node.SecondExpression as BinaryExpression).SecondExpression) as StringLiteral).Value.StartsWith("%"))
                    {
                          Console.WriteLine((((node.SecondExpression as BinaryExpression).SecondExpression) as StringLiteral).Value);
                    }
                }
            }

Conclusion

For arbitrary AST shapes, you can see that this is a very difficult issue to resolve in code. So while the ScriptDOM parser is a great tool, it does requires a fundamentally different approach to navigating the AST. Something to be kept in mind if you are attempting to use the parser in any industrial strength application.